Data Warehouse best practices
This is general guidance for DW and some of concept are
based on customer’s scenarios, this is a only guidance and customers technical
team can get an idea from here, applicability of this is depend on customers scenarios,
this is information only document.
·
Identify
the Dim and Fact
o
Dim : provide the descriptive context –
attributes with the who, what, when, why, or how. They should always include
friendly names & descriptions.
o
Dimension tables should *not* contain aggregatable
numeric values (measures)
o
Fact: Fact tables contain the numeric,
quantitative data (aka measures). Typically one fact table per distinct
business process
·
Follow good naming convention to represent
entity and attributes
·
Benefits
of a Star Schema
o
Optimal for known reporting scenarios
o
Denormalized structure, structured around
business logic, is good for performance & consistency
o
Usability
for:
§
Stable, predictable environment
§
Less joins, easier navigation
§
Friendly, recognizable names
§
History retention
§
Integrate multiple systems Decoupled from source
system
·
Performance
of DW
o
Handling Larger Fact Tables
o
Clustered Columnstore Index
§
Reducing data storage due to compression of
redundant values
§
Improving
query times for large datasets
§
Improving query times due to reduced I/O (ex:
column elimination)
§
suitable for:Tables over 1 million rows
§
Data structured in a denormalized star schema
format (DW not OLTP) ü
Support for analytical query workload which scans a large number of rows, and
retrieves few columns
§
Data which is not frequently updated (‘cold’
data not ‘hot’)
§
Can selectively be used on insert-oriented
workloads (ex: IoT)
o
Table Partitioning
§
Improving data load times due to partition
switching
§
Flexibility for maintenance on larger tables
§
Improving query performance (possibly) due
parallelism & partition elimination behavior
§
Speeding up ETL processes
§
Large datasets (50GB+) ü Small maintenance windows
§
Use of a sliding window ü Storage of partitions on
separate drives (filegroups)
§
Older (cold) data on cheaper storage
§
Historical data on read-only filegroup ü
§
Speeding up queries (possibly) ,Partition
elimination , Parallelism
·
Track
History in a DW
o
Most common options for tracking history:
§
1. Slowly changing dimension
§
2. Fact snapshot tables
§
3. Timestamp tracking fact New option in SQL
Server 2016:
§
4. Temporal data tables à Not a full replacement for
slowly changing dimensions, but definitely useful for auditing
·
Handling
of Nulls
o
Dimensions Rule of thumb is to avoid nulls in
attribute columns.
o
Best practice is to avoid nulls in foreign keys.
(However, nulls are ok for a measure.) By using an ‘unknown member’
relationship to the dimension, you can:
§
Safely do
inner joins
§
Allow the fact record to be inserted & meet
referential integrity
§
Allow the fact record to be inserted which
avoids understating measurement amounts
·
Manually Maintained Data Maintain a DML script
in a Lookup (LKP) table instead of hard-coding in the ETL
·
User SQL Data tool ( SSDT ) to compare schema
and data
·
Extensibility
in a DW Design
o
change in mind. Ex: Create a lookup table with
code/descriptions, or implement in a view, rather than hard-coding in ETL.
o
Plan for a hybrid environment with multiple
architectures. Introduce conformed dimensions first whenever possible.
o
Try to avoid isolated “stovepipe”
implementations unless the isolation is absolutely intended. Conduct active
prototyping sessions with business users to flush out requirements. A data
modeling tool like Power BI works well for this.
o
Consider using an OLAP cube or in-memory model
(like Analysis Services) for:
§
Summary
data (as opposed to summary tables in your DW) • Year-to-Date type of
calculations • Year-over-Year type of calculations • Aggregate level
calculations (as opposed to row-by-row calculations)
Summary
·
DW Design Principles
o
Staging as a “kitchen” area
o
Integrate data from multiple systems to increase
its value
o
Denormalize the data into a star schema
o
A column exists in one and only one place in the
star schema
o
Avoid snowflake design most of the time
o
Use surrogate keys which are independent from
source systems
o
Use conformed dimensions
o
Know the grain of every table
o
Have a strategy for handling changes, and for
storage of history
o
Store the lowest level of detail that you can
o
Use an ‘unknown member’ to avoid understating
facts
o
Transform the data, but don’t “fix” it in the DW
o
Structure your dimensional model around business
processes
o
Design facts around a single business event
o
Always use friendly names & descriptions
o
Use an explicit date dimension in a
“role-playing” way
o
Utilize bridge tables to handle many-to-many
scenarios
o
Plan for complexities such as:
§
Header/line data
§
Semi-additive facts
§
Multiple currencies
§
Multiple units of measure
§
Alternate hierarchies and calculations per
business units
§
Allocation of measures in a snowflake design
§
Reporting of what didn’t occur (factless facts)
§
Dimensional only analysis
·
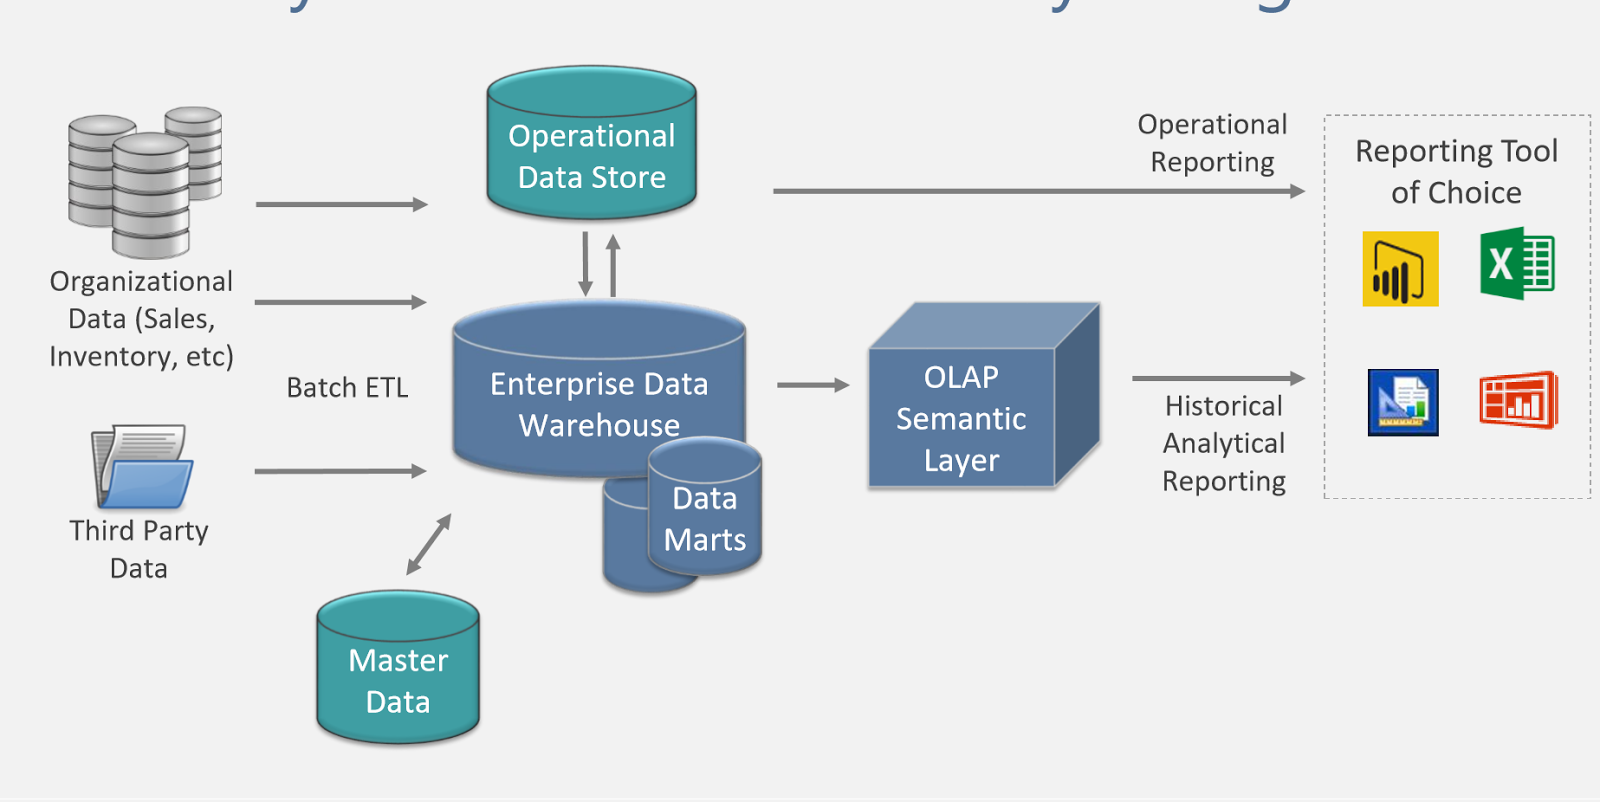
Reference
architectures